 Page top
 Previous
 Homepage
 Next
Next
Stacked Area Graph

Description
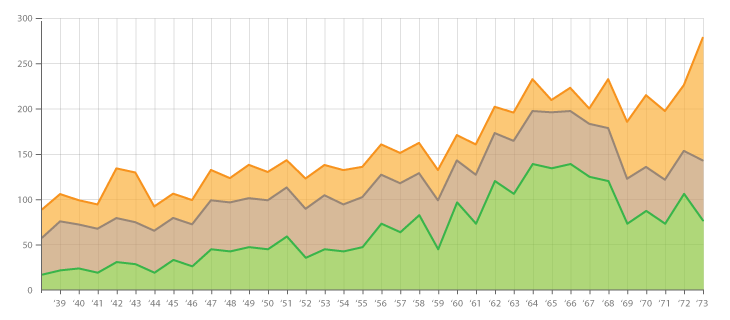
Stacked Area Graphs work the same way as simple Area Graphs, except for displaying multiple data series that start each point from the point left by the previous data series.
The entire graph represents the total of all the data plotted. Stacked Area Graphs also use the areas to convey whole numbers, so they do not work for negative values. Overall, they are useful for comparing multiple variables changing over time.
Functions
Anatomy

Tools to Generate Visualisation
Code-based:
amCharts (JS)
AnyChart (JS)
Apache ECharts (JS)
CanvasJS (JS)
Chart.js (JS)
D3.js Graph Gallery (D3.js)
Google Charts (HTML5)
Highcharts (JS)
JSCharting (JS)
Plotly (Python)
Python Graph Gallery (matplotlib, pandas)
R Graph Gallery (R, ggplot2)
Vega
Vega-Lite
ZingChart (JS)
ZoomCharts (JS)
Webapp:
Datavisual
Datawrapper
Datylon
Flourish
Google Docs
Infogram
Slemma
Desktop App:
Apple Numbers
Microsoft Office, PowerBI
Tableau


