 Page top
 Homepage
 Next
Next
Arc Diagram

Description
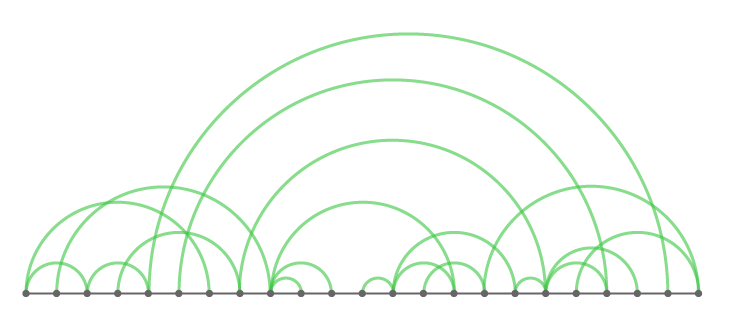
Arc Diagrams are an alternate way of representing two- dimensional Network Diagrams. In Arc Diagrams, nodes are placed along a single line (a one-dimensional axis) and arcs are used to show connections between those nodes.
The thickness of each arc line can be used to represent frequency between the source and target node. Arc Diagrams can be useful in finding the co-occurrence within the data.
The downside to Arc Diagrams is they don't show structure and connections between nodes as well as 2D charts do and too many links can make the diagram hard to read due to clutter.
- - -
Combining Arc Diagrams with other visualisations.
Academic research done on Arc Diagrams.
Functions
Anatomy

Similar Charts
Tools to Generate Visualisation
Code-based:
Data to Viz (R)
Highcharts
Protovis
Sophie Engle’s Block (D3)
Webapp:
RAWGraphs


